Stratigraphical charts for the Quaternary
The formal division of the Quaternary is the responsibility of the IUGS International Commission on Stratigraphy’s (ICS) Subcommission on Quaternary Stratigraphy (SQS), in partnership with the International Union for Quaternary Research’s (INQUA) Commission on Stratigraphy and Chronology (SACCOM).
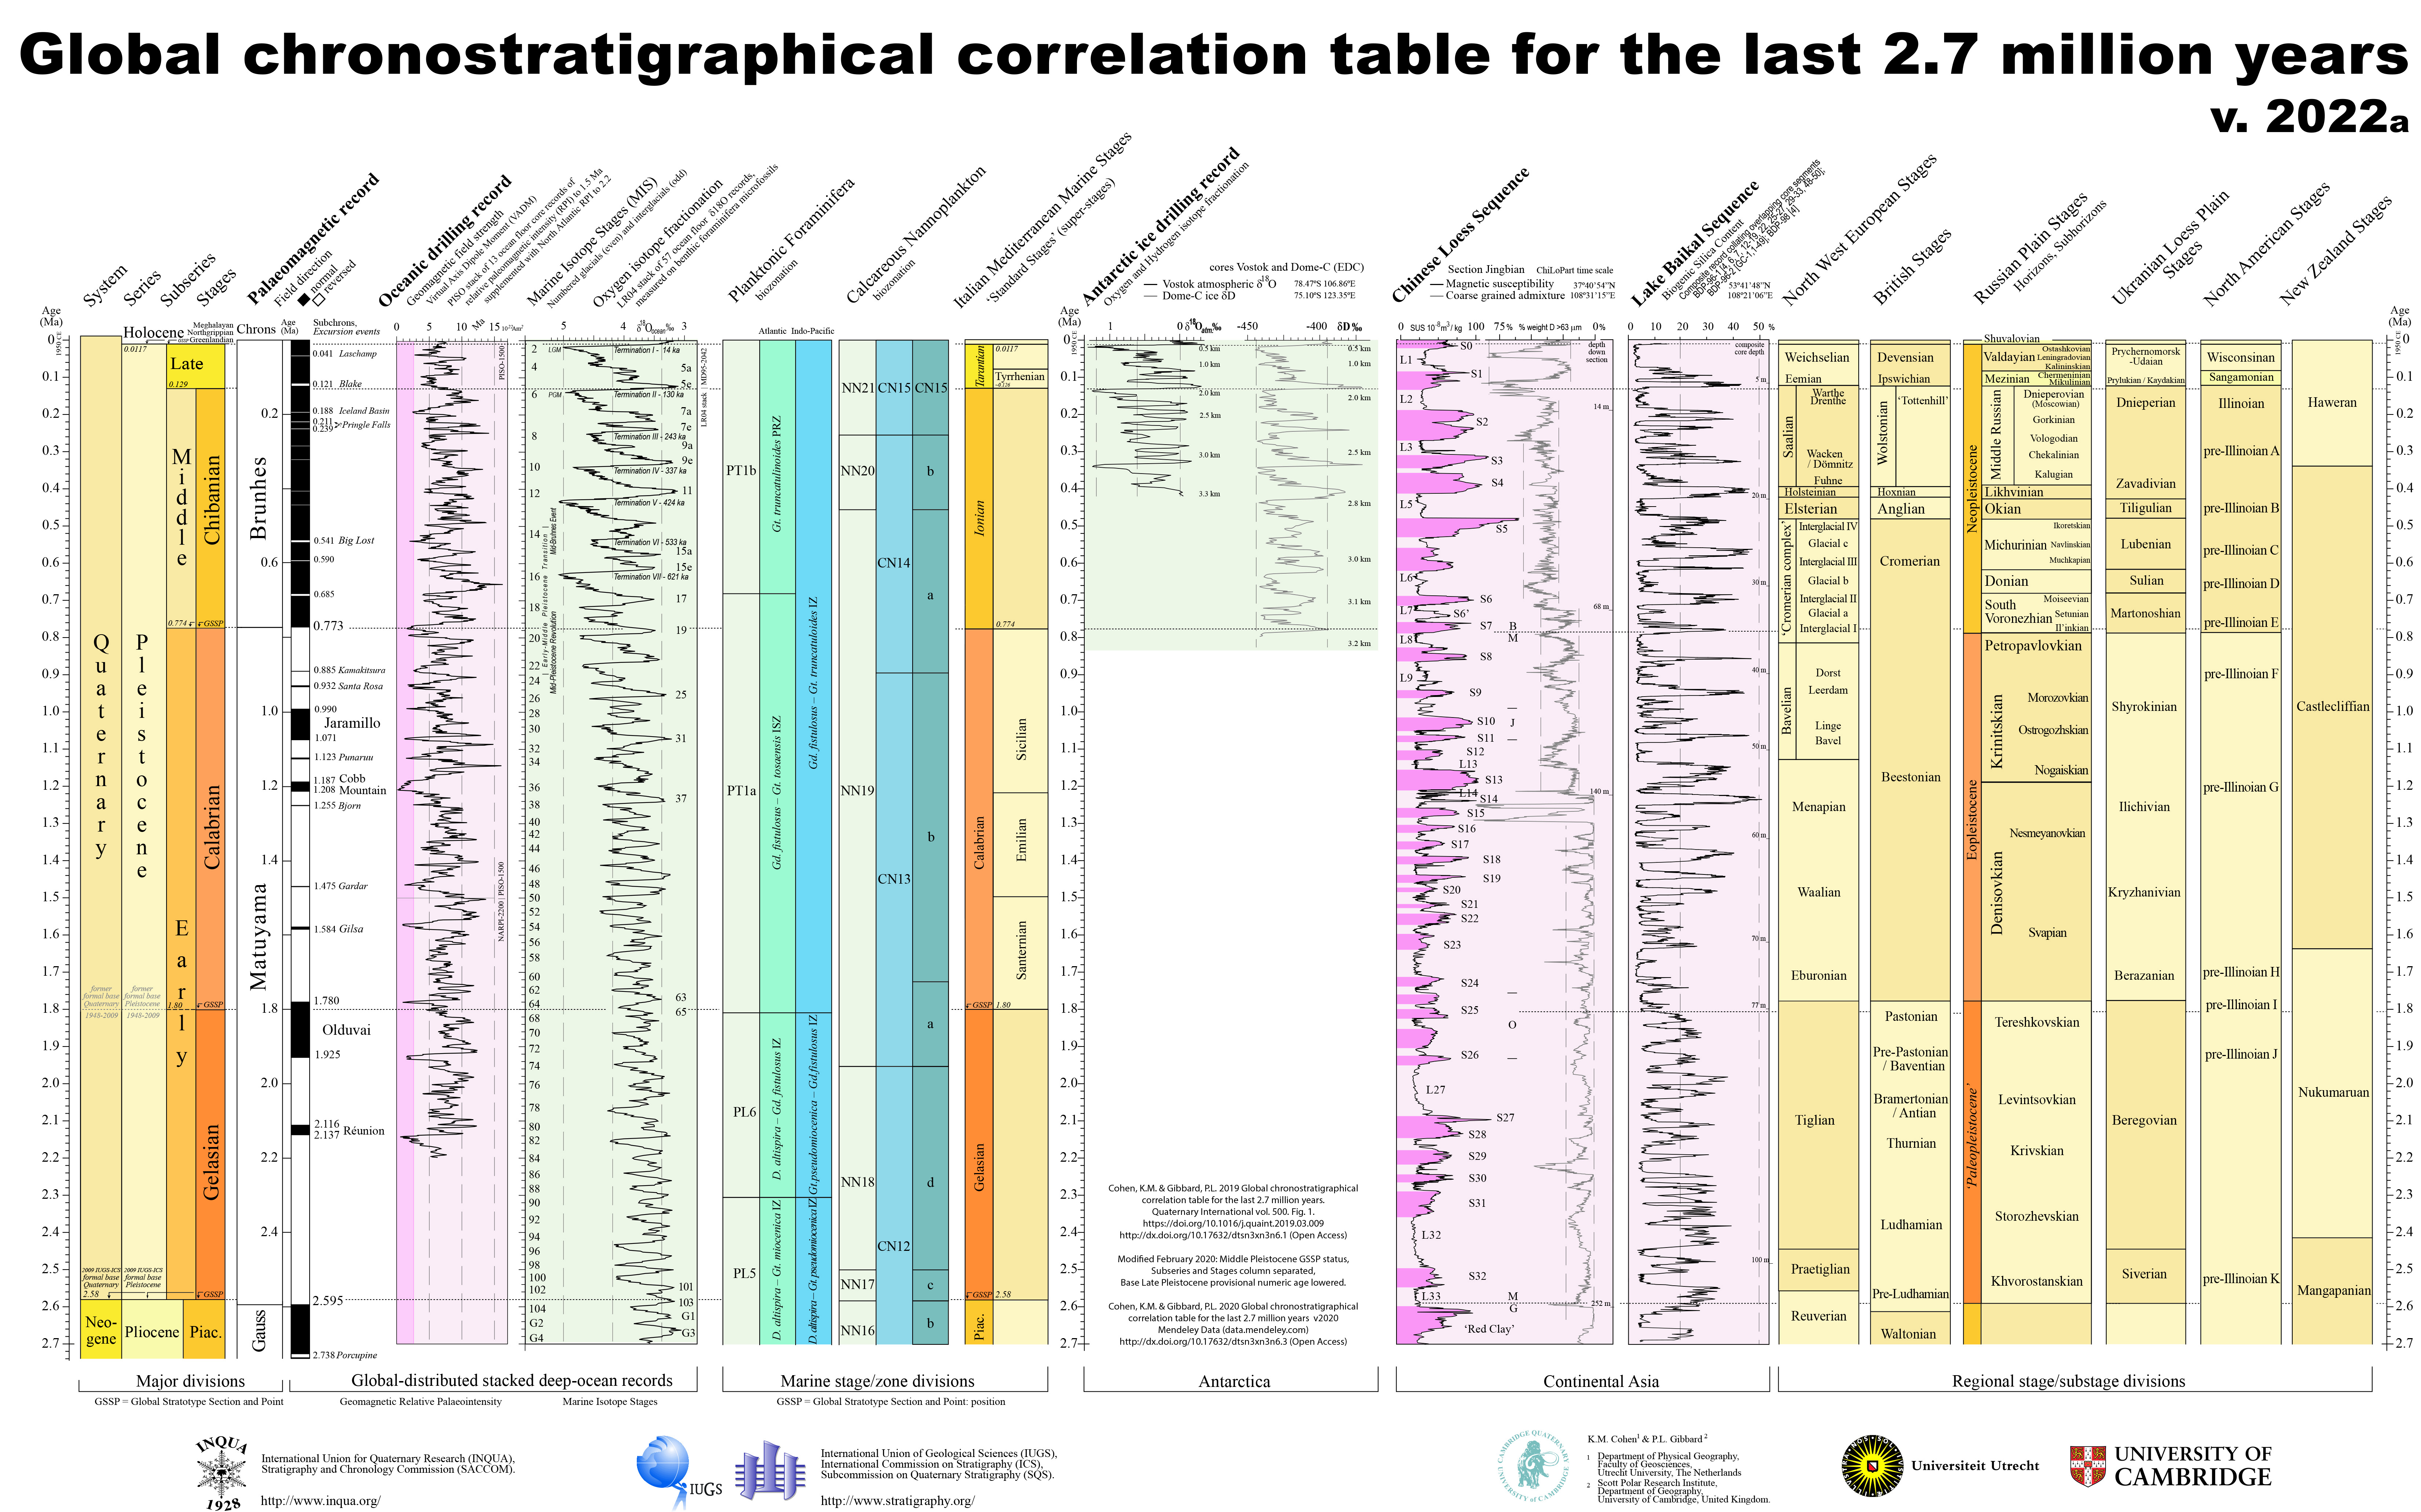
Global chronostratigraphical correlation table for the last 2.7 million years
The table provides a correlation of chronostratigraphical subdivisions of late Cenozoic geological time, spanning the last 2.7 million years. The timescale of the correlation table is based on the internationally-recognised formal time subdivisions: the Phanerozoic Eonothem/Eon; the Cenozoic Erathem/Era; the Quaternary System/Period; the Pleistocene and Holocene epochs/series; and finally the Lower/Early, Middle, and Upper/Late Pleistocene subseries/subepochs and their associated stages/ages. Official units of the Geological Time Scale are defined at their base by a Global boundary Stratotype Section and Point (GSSP) of which six have currently been ratified within the last 2.7 million years (the GSSP for the Upper Pleistocene and its associated stage is pending).
The chart should be referred to as : Cohen K.M. & Gibbard, P., 2019, Global chronostratigraphical correlation table for the last 2.7 million years, version 2019 QI-500. Quaternary International, 500, 20–31.
Previous versions of the chart were published as Gibbard et al. 2004, 2005, Gibbard & Cohen, 2008 and Gibbard & Cohen, 2009.
- The 2022 version of the chart is available for download as: as a JPG (large 5.4 Mb) | as a PDF file (555 Kb) | 2022 documentation
- The 2019 version of the chart is available for download as: as a JPG (large 5.7 Mb) | as a PDF file (669 Kb) | 2019 documentation
- The past 50 kyr (fig. 2 of Cohen & Gibbard, 2019) from the 2019 version of the chart is available for download as: as a JPG (large 3.5 Mb) | as a PDF file (417 Kb) | 2019 documentation
- The 2016 version of the chart is available for download as: as a JPG (large 5.3 Mb) | as a PDF file (505 Kb) | 2016 documentation
- The 2011 version of the chart is available for download as: as a JPG (large 5.9 Mb) | as a PDF file (1000 Kb) | 2011 documentation
- The 2010 version of the chart is available for download as: a JPG file (large 1.8 Mb) | as a PDF file (407 Kb) | 2010 documentation
- The 2009 version of the chart is available for download as: a JPG file (large 2.1 Mb) | as a PDF file (433 Kb) | 2009 documentation
- The 2008 version of the chart is found here: Episodes 2008 correlation chart PDF (584 Kb) (chart, documentation, full references)
- Archived older versions of the chart are found here.
Other Charts
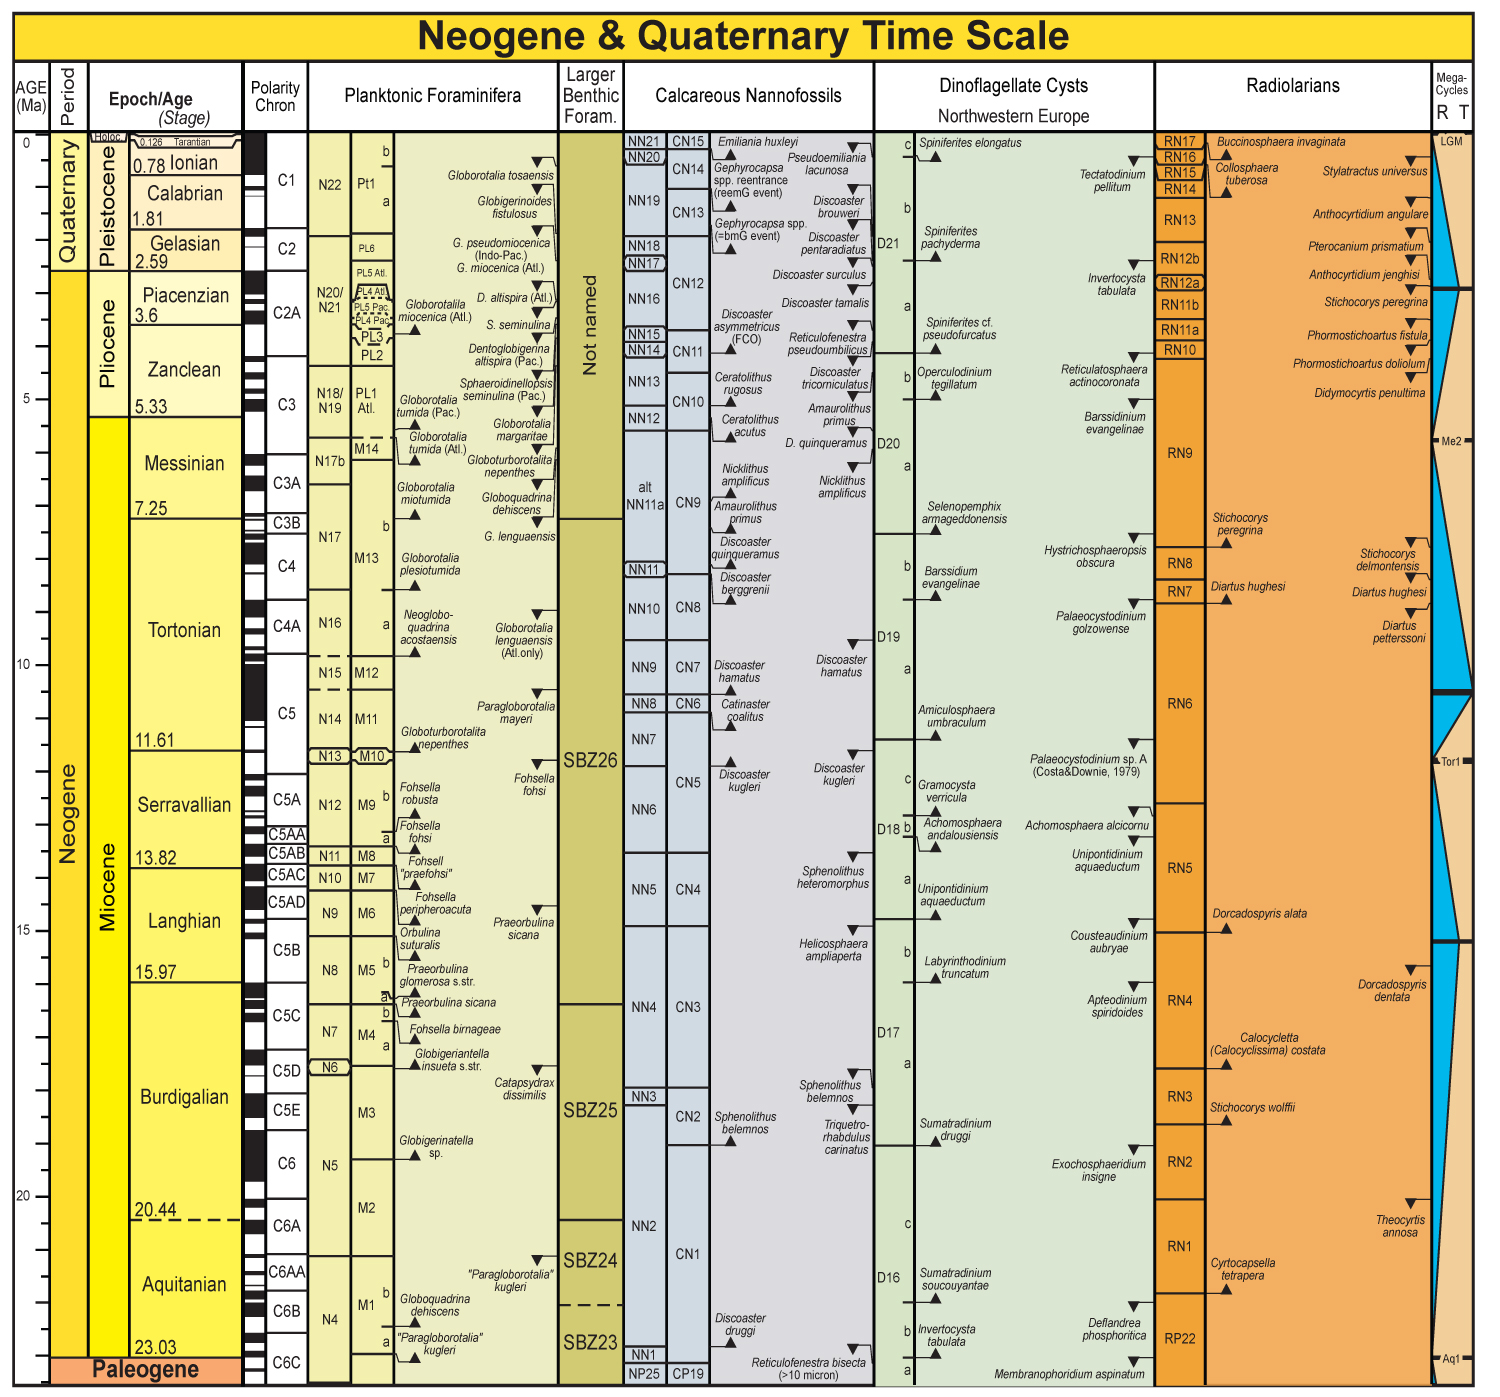
Geologic Time Scale 2012
Correlation of late Cenozoic chronostratigraphical divisions from the Geologic Timescale 2012 (Gradstein et al.). Drawn and reproduced by kind permission of Jim and Gabi Ogg. click on image to download a jpg version.
New Zealand
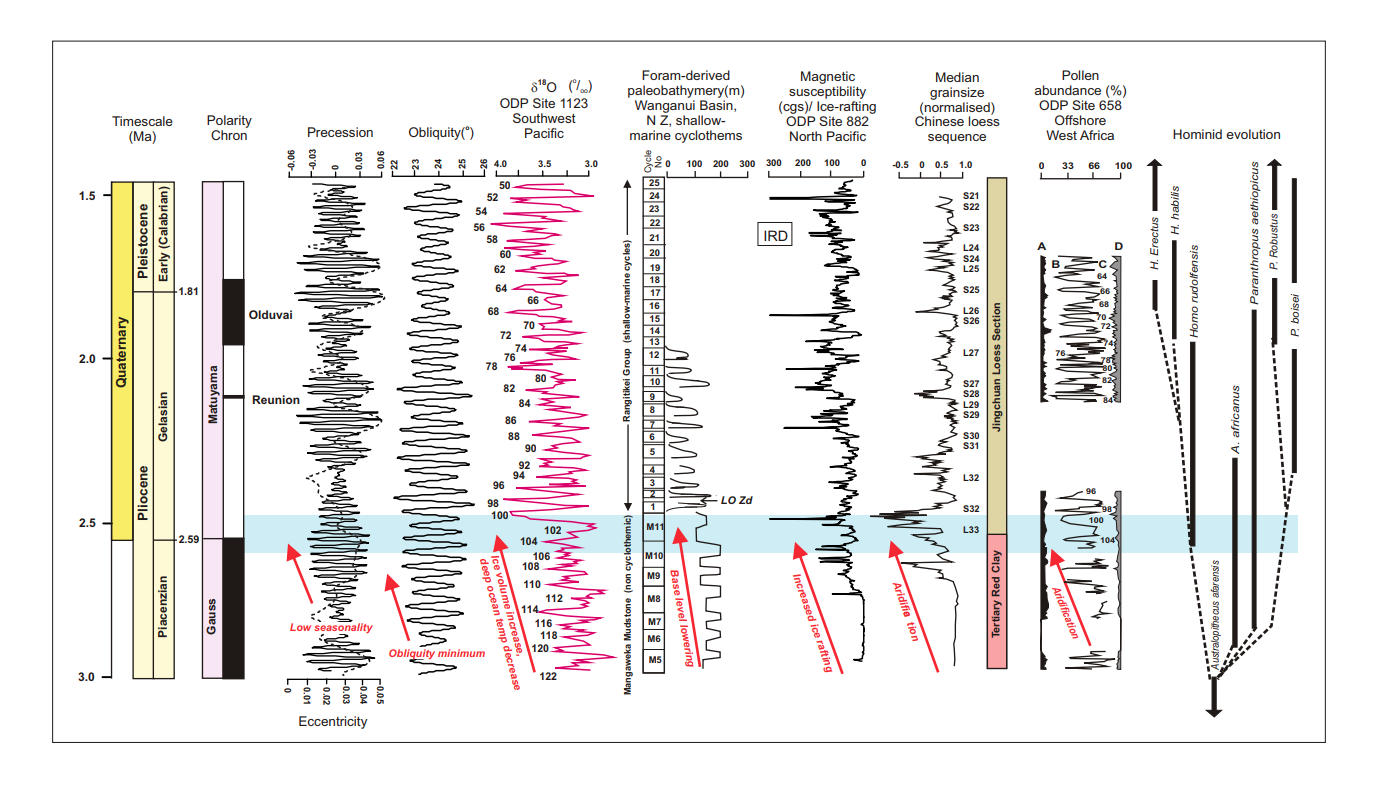
Temporal and latitudinal relations between orbital forcing and Earth’s Late Pliocene-Early Pleistocene climate (3.0-1.5 Ma) as recorded by a high-resolution deep ocean δ18O ice volume record from Southwestern Pacific ODP site 1123, glacio-eustatic cyclothems of Wanganui Basin New Zealand, ice rafting as recorded by magnetic susceptibility at North Pacific ODP site 882, and a median grainsize profile of the Jingchuan Loess Section, North central China Loess Plateau. LO Zd denotes first appearance in North Island of New Zealand stratigraphic record of the subantarctic scallop Zygochlamys delicatula during glacial periods, traditionally marking the Plio-Pleistocene boundary in New Zealand. Pollen summary diagram from ODP 658, offshore West Africa shows progressive aridification of Northwest Africa between 2.8 and 2.4 Ma, as (B) sahel-savanna grassland and open forest elements are replaced by drier (C) saharan desert vegetation. Subordinate vegetation assemblages (A) and (D) represent a tropical coastal forest and “Mediterranean” (trade wind) elements, respectively. Note well-developed 40ka glacial-interglacial modulation of the sahel-savanna boundary following 2.6Ma. A step-like increase in African aridity about 2.8 Ma is linked to a significant event in hominid evolution in East Africa as the genera Paranthropus and Homo emerge from a single lineage (Australopithecus afarensis). Originally from Pillans and Naish (2004) but reproduced in J.G Ogg & B.Pillans 2008 Establishing Quaternary as a formal international Period/System. Episodes 31. 230-233.
Click on image to download a pdf version.
Elsewhere on the web – The following sites produce up to date stratigraphical charts for all divisions of geological time:
- stratigraphy.org – by IUGS – ICS
- GSSP web site
Iberian Chronostratigraphical Chart for the last 3 million years – This chart, Tabla Cronoestratigráfica del Cuaternario de la Península Ibérica, is produced by AEQUA
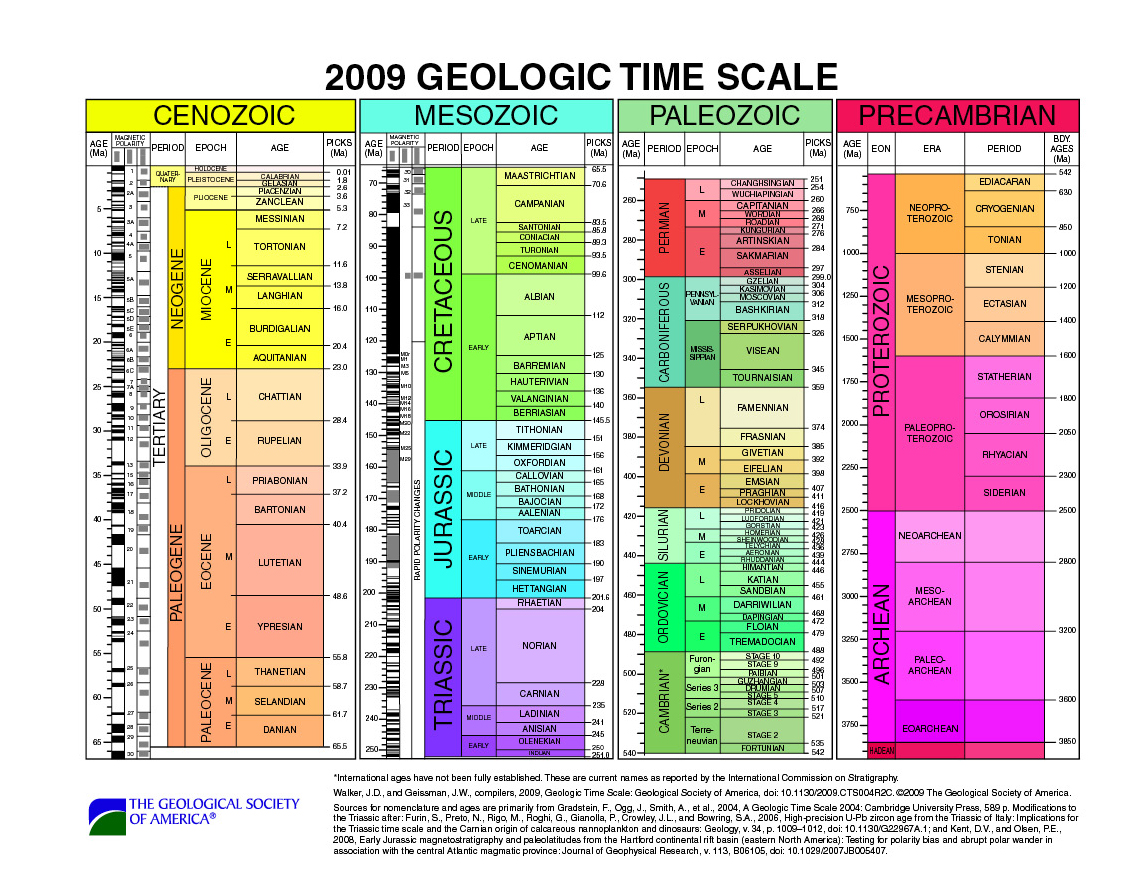
GSA Geologic Time Scale
A 2009 Geologic Time Scale chart by the Geological Society of America published in GSA Today.
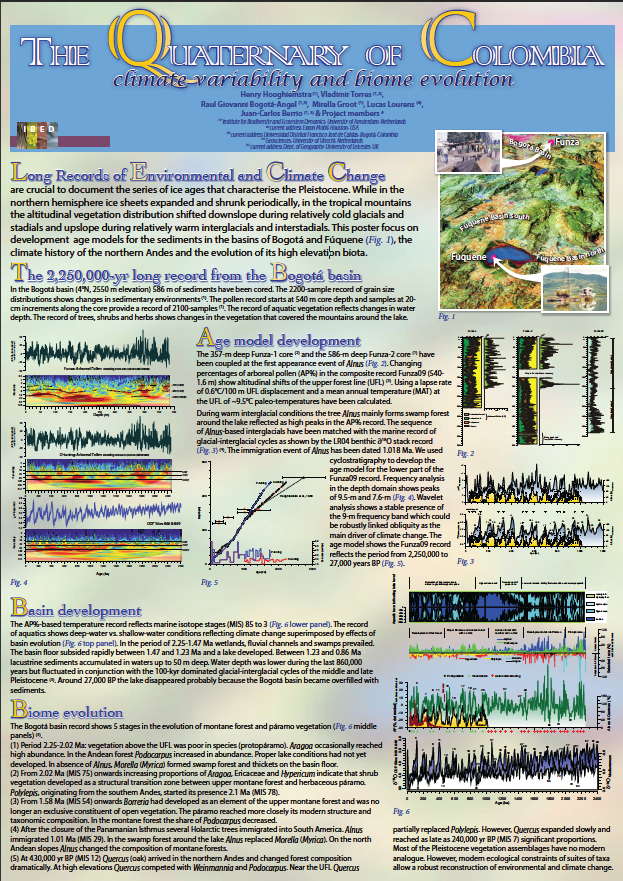
The Quaternary of Colombia
The Quaternary of Colombia (a low resolution version 3.2 mb) – a summary of research on the critically important sequences of Colombia by Henry Hooghiemstra [H.Hooghiemstra@uva.nl] (University of Amsterdam). A high-resolution version (21.8 mb) is available direct from Professor Hooghiemstra.